Overview
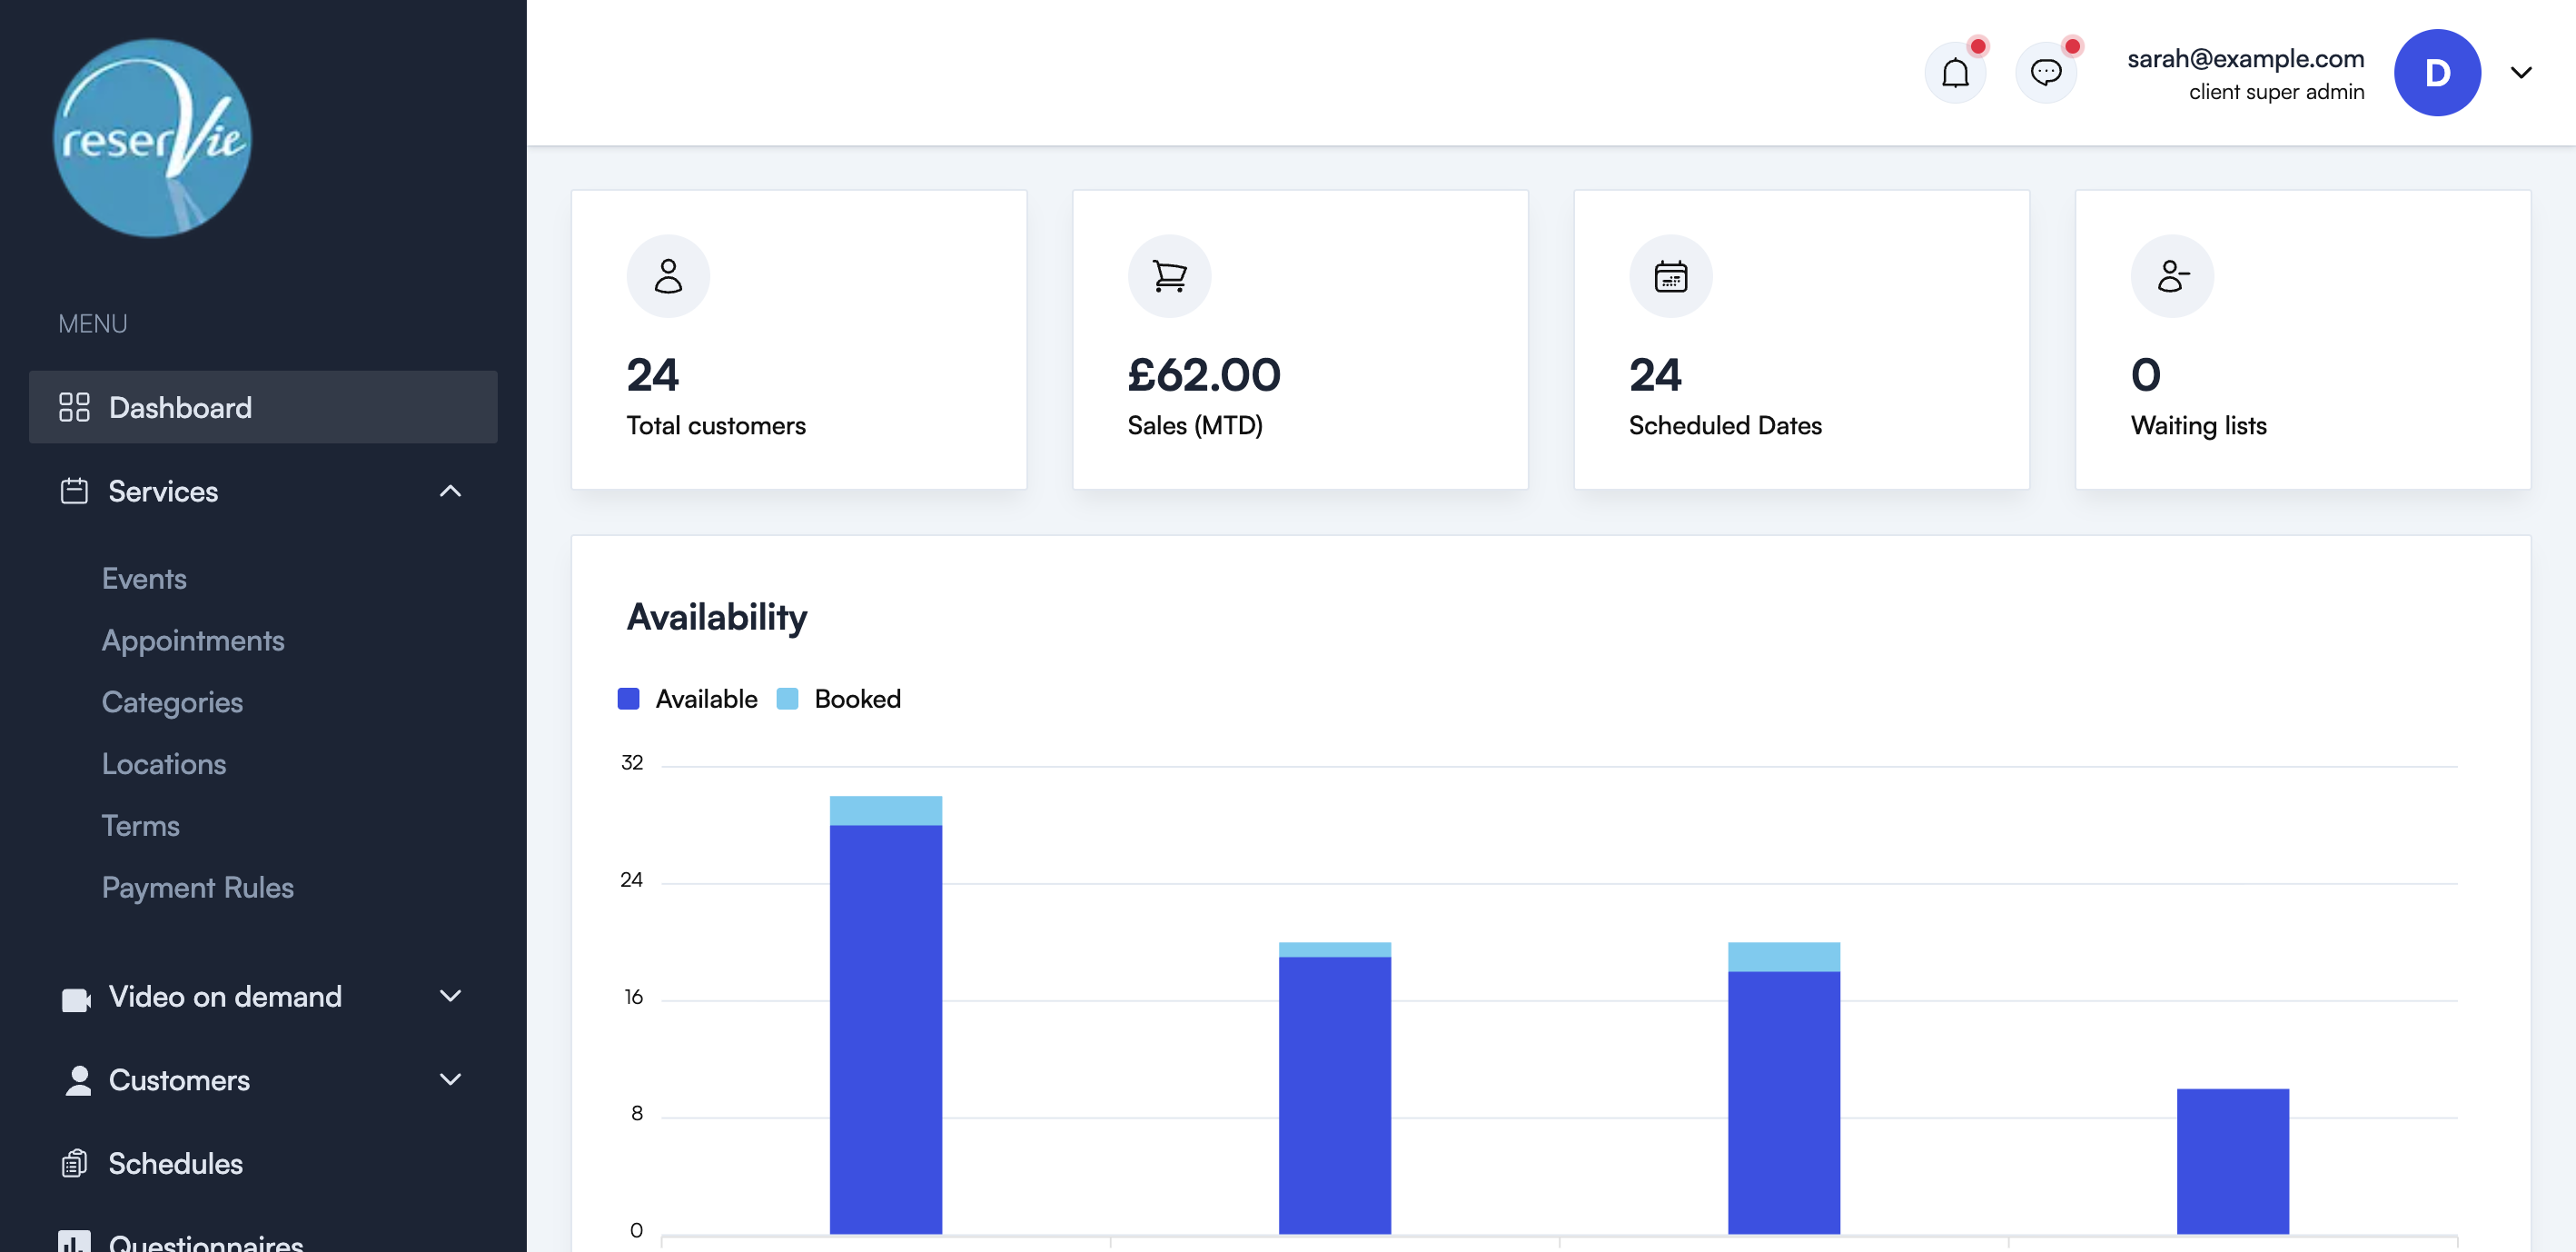
The dashboard is the first page you see when you log in to the reservie admin panel. It provides an at-a-glance overview of your business, including summary statistics, upcoming events, waiting lists, and sales data.
Summary stats
Four key metrics are displayed at the top of the dashboard:
| Stat | Description |
|---|---|
| Total Customers | The total number of customers registered in your account |
| Sales (MTD) | Month-to-date sales revenue |
| Scheduled Dates | The number of upcoming event dates |
| Waiting Lists | The number of customers currently on waiting lists |
Availability chart
The availability chart shows a visual comparison of Available vs Booked places across your upcoming event dates. This helps you see which days have spare capacity and which are filling up.
Upcoming events
The events section lists your upcoming events for the next 7 days, showing:
| Column | Description |
|---|---|
| Name | The event name |
| When | The date and time of the event |
| Sold | The number of tickets sold |
Waiting lists
The waiting list section shows customers who are on a waiting list, including:
| Column | Description |
|---|---|
| Name | The customer name |
| Contact | The customer’s contact details |
| Event | The event they are waiting for |
| When | The date of the event |
Sales
Sales table
The sales table shows recent purchases in a paginated table with:
| Column | Description |
|---|---|
| Purchased | The date and time of the purchase |
| Name | What was purchased |
| Type | The type of purchase (event, pass, etc.) |
| When | The event date |
| Who | The customer who made the purchase |
Sales chart
A line chart showing sales over time. You can toggle between Day, Week, and Month views to see trends at different levels.
Purchases chart
A breakdown of purchases by type — Events, Passes, Videos, and Gift Vouchers — giving you an overview of where your revenue is coming from.